CHAPTER VIII: POPULATION
- INTRODUCTION
- POPULATION GROWTH
- Table VIII-1 Historical Population Trends:
Plainfield, Tri-Town Area*, Sullivan County, New Hampshire; 1767-2010 - Chart VII-1: Plainfield Population 1767-2010
- Table VIII-2 Relative Shares of Population:
Plainfield, Sullivan County, New Hampshire, U.S.A.; 1767-2010 - Table VIII-3 Population Density in Selected Upper Valley-Lake Sunapee Communities 1960-2010
- NATURAL INCREASE AND MIGRATION
- AGE DISTRIBUTION
- Table VIII-4 Median Ages:
Plainfield, Sullivan County, and New Hampshire - Chart VIII-5 Historgram of Age Distribution
- Table VIII-6 Age and Gender Distribution
- Pre-school and Student Population
- Working-Age (Labor Force) Population
- Elderly Population
- POVERTY
- Table VIII-9 Poverty Level in Select Geographic Areas
- Table VIII-10 Plainfield Poverty Distribution 2010 Census
- Table VIII-11 Plainfield Poverty Distribution ACS_SF 2006-2010 Estimates
- Table VIII-12 Plainfield Income by Source
- POPULATION PROJECTIONS
- CHANGES IN PLAINFIELD
- RECOMMENDATION
INTRODUCTION
Since one of the purposes of a master plan is to provide and improve facilities for people's lives, work and families, an analysis of changing trends in a town's population is of basic importance. Any significant changes in the population will consequently affect land use patterns, the town's economic base, and local demand for housing, transportation, human services and community facilities. Awareness of shifts in the population composition is also prerequisite for planning; specifically, changes in the school age and elderly populations could require corresponding reviews of educational, housing and service policies.
Three facets of Plainfield's population are examined here. First, natural increase and migration patterns affecting Plainfield's population growth are analyzed. Then, the age distribution of Plainfield residents is considered. Finally, population projections through the year 2020 for the Town are set forth, indicating the degree of change which may be expected in the next 20 years.
Information for this report was derived from a variety of sources. The U.S. Census of Population and ACS Estimates provided most of the data. Publications from the New Hampshire Office of Energy and Planning (OEP) also served as input.
POPULATION GROWTH
Plainfield's population began to slowly increase after 1920 and climbed from 1,050 in 1950 to 2346 in 2010. The rate of growth accelerated in the late 1960's and 1970's but has decreased significantly in the last two decades. The growth has been due to increasing employment opportunities in the neighboring communities of Lebanon, Hanover, Claremont and Hartford. A variety of employers required an increasingly large labor force. Selecting these new employment opportunities resulted in a changed lifestyle for many Plainfield residents and the near extinction of the small farm. With the influx of newcomers and a change in economic structure, Plainfield has been successful in largely retaining its rural charm and desirability as a residential community.
Tables VIII-1 and VllI-2, and Chart VIII-1, on the following pages, present the historical trend of Plainfield's population growth. Table VIII-2 shows that from a peak of 11% in 1790, Plainfield has been a slowly decreasing proportion of Sullivan County's population until 1930. After an early twenty-year surge, the Town's population growth did not keep pace with that of the County as a whole, and the Town's share of County population fell to only 3.5%. Since 1930, however, Plainfield has grown fast enough to raise its share of the County population to 5.4 % in the year 2010.
The growth experienced by Plainfield since 1960 has resulted in rapid development of its land base. Table VIII-3 summarizes the population density of selected communities in the Upper Valley Region. Plainfield's land area is slightly larger than most of its neighbors. With a population of 2241, the Town is one of the more sparsely settled communities in the area, having a density of 42.3 persons per square mile. Only Croydon (17.6 persons per square mile) and Cornish (30.0 persons per square mile have lower population density; on the other hand, Lebanon (304.3 persons per square mile) and Claremont (298.2 persons per square mile) are seven times as densely populated.
Table VIII-1 Historical Population Trends: Plainfield, Tri-Town Area*, Sullivan County, New Hampshire; 1767-2010
| Year | Plainfield | % Chg | Tri-Town* | % Chg | Sullivan County | % Chg | State of NH | % Chg |
|---|---|---|---|---|---|---|---|---|
| 1767 | 112 | 816 | ||||||
| 1773 | 275 | 145.6 | 2,184 | 167.6 | ||||
| 1775 | 308 | 12 | 2,610 | 19.5 | ||||
| 1783 | 2,595 | -0.6 | ||||||
| 1786 | 580 | 6,259 | 141.2 | |||||
| 1790 | 1024 | 76.6 | 3548 | 9,107 | 45.5 | 141,885 | ||
| 1800 | 1435 | 40.1 | 4980 | 40.4 | 14,537 | 59.6 | 183,858 | 29.6 |
| 1810 | 1463 | 2 | 5774 | 15.9 | 16,514 | 13.6 | 214,460 | 16.6 |
| 1820 | 1460 | -0.2 | 5942 | 2.9 | 18,533 | 12.2 | 244,161 | 13.9 |
| 1830 | 1581 | 8.3 | 6273 | 5.8 | 19,669 | 6.1 | 269,328 | 10.3 |
| 1840 | 1552 | -1.8 | 6708 | 6.5 | 20,340 | 3.4 | 284,574 | 5.7 |
| 1850 | 1392 | 10.3 | 6645 | -0.1 | 19,375 | -4.7 | 317,976 | 11.7 |
| 1860 | 1620 | 16.4 | 7026 | 5.7 | 19,041 | -1.7 | 326,073 | 2.6 |
| 1870 | 1589 | -1.9 | 7659 | 9 | 18,058 | -5.2 | 318,300 | -2.4 |
| 1880 | 1372 | -13.7 | 8455 | 10.4 | 18,161 | 0.6 | 346,991 | 9.0 |
| 1890 | 1173 | -14.5 | 9320 | 10.2 | 17,304 | -4.7 | 376,530 | 8.5 |
| 1900 | 1114 | -5 | 10666 | 14.4 | 18,009 | 4.1 | 411,588 | 9.3 |
| 1910 | 987 | -11.4 | 11972 | 12.2 | 19,337 | 7.4 | 430,572 | 4.6 |
| 1920 | 853 | -13.6 | 13165 | 9.9 | 20,922 | 8.2 | 443,083 | 2.9 |
| 1930 | 858 | 0.6 | 15004 | 13.9 | 24,286 | 16.1 | 465,293 | 5.0 |
| 1940 | 970 | 13.1 | 15994 | 6.6 | 25,442 | 4.8 | 491,524 | 5.6 |
| 1950 | 1011 | 4.2 | 20581 | 28.7 | 26,441 | 3.9 | 533,242 | 8.5 |
| 1960 | 1071 | 5.9 | 22983 | 11.7 | 28,067 | 6.1 | 606,921 | 13.8 |
| 1970 | 1323 | 23.5 | 24696 | 7.5 | 30,949 | 10.3 | 737,578 | 21.5 |
| 1980 | 1749 | 32.2 | 28216 | 14.3 | 36,063 | 16.5 | 920,475 | 27.8 |
| 1990 | 2056 | 17.6 | 30799 | 9.2 | 38,592 | 7 | 1,109,252 | 20.5 |
| 2000 | 2241 | 1.9 | 33786 | 9.7 | 40,458 | 4.8 | 1,235,786 | 11.4 |
| 2010 | 2364 | 1.1 | 34360 | 1.7 | 43,742 | 8.1 | 1,316,470 | 6.5 |
*Hartford, Hanover, Lebanon
SOURCE: U.S. Census
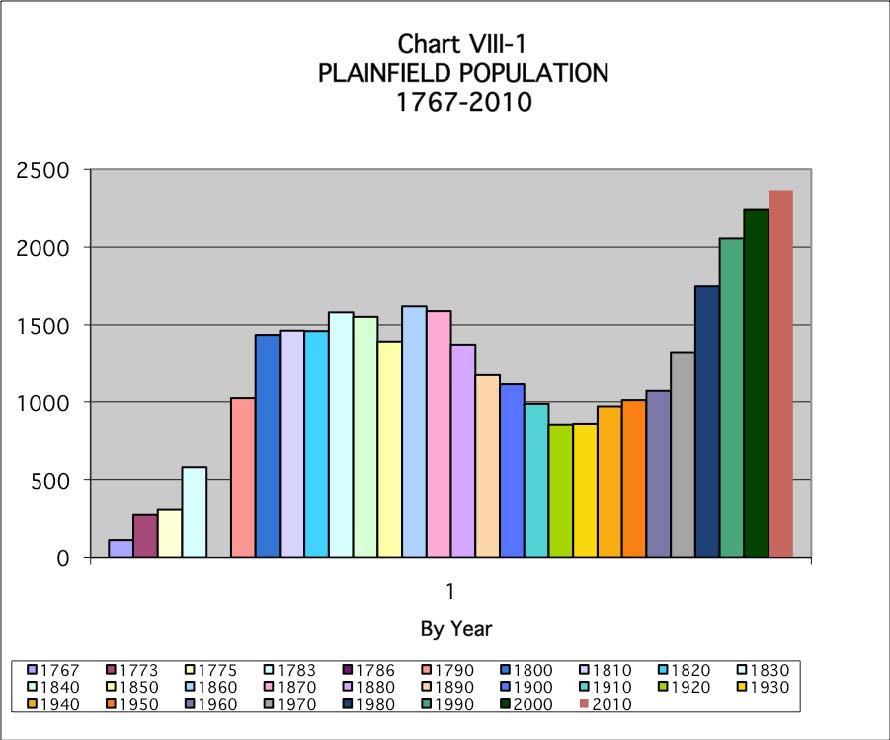
TABLE VIII-2: Relative Shares of Population:
Plainfield, Sullivan County, U.S.A.; 1767-2010
| Year | Plainfield | % of Sullivan County | Sullivan County | % of NH | NH State | % US | U.S.A. |
|---|---|---|---|---|---|---|---|
| 1767 | 112 | 13.7 | 816 | - | - | - | - |
| 1773 | 275 | 12.6 | 2,184 | - | - | - | - |
| 1775 | 308 | 11.8 | 2,610 | - | - | - | - |
| 1783 | 580 | 22.4 | 2,595 | - | - | - | - |
| 1786 | 6,259 | - | - | - | - | ||
| 1790 | 1,024 | 11.2 | 9,107 | 6.4 | 141,885 | 3.61 | 3,929,214 |
| 1800 | 1,435 | 9.9 | 14,537 | 7.9 | 183,858 | 3.46 | 5,308,483 |
| 1810 | 1,463 | 8.9 | 16,514 | 7.7 | 214,460 | 2.96 | 7,239,881 |
| 1820 | 1,460 | 7.9 | 18,533 | 7.6 | 244,161 | 2.53 | 9,638,453 |
| 1830 | 1,581 | 8 | 19,669 | 7.3 | 269,328 | 2.09 | 12,866,029 |
| 1840 | 1,552 | 7.6 | 20,340 | 7.1 | 284,574 | 1.66 | 17,069,453 |
| 1850 | 1,392 | 7.2 | 19,375 | 6.1 | 317,976 | 1.37 | 23,191,876 |
| 1860 | 1,620 | 8.5 | 19,041 | 5.8 | 326,073 | 1.03 | 31,443,321 |
| 1870 | 1,589 | 8.8 | 18,058 | 5.7 | 318,300 | 0.80 | 39,818,449 |
| 1880 | 1,372 | 7.6 | 18,161 | 5.2 | 346,991 | 0.69 | 50,155,783 |
| 1890 | 1,173 | 6.8 | 17,304 | 4.6 | 376,530 | 0.60 | 62,947,714 |
| 1900 | 1,114 | 6.2 | 18,000 | 4.4 | 411,588 | 0.54 | 75,994,575 |
| 1910 | 987 | 5.1 | 19,337 | 4.5 | 430,572 | 0.47 | 92,228,496 |
| 1920 | 853 | 4.1 | 20,922 | 4.7 | 443,083 | 0.42 | 106,021,537 |
| 1930 | 858 | 3.5 | 24,286 | 5.2 | 465,293 | 0.38 | 123,202,624 |
| 1940 | 970 | 3.8 | 25,442 | 5.2 | 491,524 | 0.37 | 132,164,569 |
| 1950 | 1,011 | 3.8 | 26,441 | 5.0 | 533,242 | 0.35 | 151,325,798 |
| 1960 | 1,071 | 3.8 | 28,067 | 4.6 | 606,921 | 0.34 | 179,323,175 |
| 1970 | 1,323 | 4.3 | 30,949 | 4.2 | 737,578 | 0.36 | 203,211,926 |
| 1980 | 1,749 | 4.8 | 36,063 | 3.9 | 920,475 | 0.40 | 226,504,825 |
| 1990 | 2,056 | 5.3 | 38,592 | 3.5 | 1,109,252 | 0.40 | 248,710,000 |
| 2000 | 2,241 | 5.5 | 40,458 | 3.3 | 1,235,786 | 0.44 | 281,421,906 |
| 2010 | 2,364 | 5.4 | 43,742 | 3.3 | 1,316,470 | 0.43 | 308,745,538 |
TABLE VIII-3: Population Density in Selected Communities 1960-2010
| Town | Land Area Square Miles | Persons Per Square Mile | |||||
|---|---|---|---|---|---|---|---|
| 1960 | 1970 | 1980 | 1990 | 2000 | 2010 | ||
| Plainfield | 53.0 | 20.2 | 25.0 | 33.0 | 37.9 | 42.3 | 44.6 |
| Claremont | 44.1 | 307.6 | 322.8 | 330.5 | 315.6 | 289.2 | 302.8 |
| Cornish | 42.6 | 26.0 | 29.8 | 32.6 | 38.9 | 39.0 | 38.5 |
| Croydon | 37.5 | 8.32 | 10.5 | 12.2 | 16.7 | 17.6 | 20.3 |
| Enfield | 43.1 | 43.3 | 54.3 | 73.6 | 92.2 | 107.1 | 106.3 |
| Grantham | 28.0 | 11.9 | 13.0 | 25.1 | 44.5 | 77.4 | 106.6 |
| Hanover | 50.1 | 146.3 | 169.4 | 181.9 | 183.7 | 216.6 | 224.75 |
| Hartford | 46.0 | 138.2 | 140.8 | 173.1 | 204.5 | 225.4 | 216.3 |
| Lebanon | 41.3 | 225.2 | 235.6 | 269.8 | 295.2 | 304.3 | 318.4 |
| Newport | 43.6 | 125.2 | 135.2 | 142.7 | 147.6 | 143.8 | 149.2 |
SOURCE:, U.S. Census
Even with its large land base and relatively low density, Plainfield must plan wisely for the future to assure that the Town grows in a desirable manner. Growth increases density, which, in turn, decreases the amount of open space, places greater demand on local resources, and increases the possibility of conflicting land uses. The planning that Plainfield does now can preclude untimely and unmanageable future expansion.
NATURAL INCREASE AND MIGRATION
The two components of population change are natural increase and migration. Natural increase is defined as the excess of resident births over deaths; migration refers to the number of people moving into and out of a town. If a community has little in- and out-migration, almost all changes in population are attributable to natural factors alone. The change in Plainfield's population is broken down as follows:
The population at the close of a period is equal to the population at the start of the period plus natural increase during the period, plus net migration during the period.
During the decade of the 1970's, Plainfield's total population increased by 426 residents, or 32%. Natural increase accounted for 34% of the change and the remainder, 280 people or 66% of the newcomers, were in-migrants.
During the 1980's, population growth slowed. The total population increase was 307 residents, a 17.5% increase. During that time, 38% of the population increase (118 people) can be attributed to natural increase, and 62% (189 people) was the result of in-migration.
During the 90's a smaller population increase occurred of only 185 persons of which 75 were attributable to natural increase and 110 were due to in-migration.
From 2000 to 2010, the inward migration accounted for 75% of the increase in population.
AGE DISTRIBUTION
Understanding the age composition of a community is vital in planning for future needs. A change in the school age population, for example, may indicate a need for modification in educational policies. Likewise, a shift to a more elderly population would require that a different type and range of services and facilities be developed. The median age of Plainfield residents is slightly younger than Sullivan County and slightly older than the New Hampshire median, as the table below shows. In addition, this table shows a general aging trend taking place in the past two decades in all three geographic regions, as it has nationally.
TABLE VIII-4: Median Ages in Plainfield, Sullivan County, and New Hampshire
| Area | Median Ages | ||||
|---|---|---|---|---|---|
| 1970 | 1980 | 1990 | 2000 | 2010 | |
| Plainfield | 26.7 | 30.0 | 34.5 | 40.0 | 45.2 |
| Sullivan County | 30.0 | 31.6 | 35.3 | 40.0 | 43.9 |
| New Hampshire | 27.8 | 30.1 | 32.8 | 37.1 | 41.1 |
SOURCE: U.S. Census; 1970, 1980, 1990, 2000, 2010
Table VIII-4 shows median age at decennial for select geographies. Chart VIII-5 shows age distribution by age group. The effect of the net in-migration to Plainfield shows up in the 20-64 age group. This is the group with the greatest numerical and percentage increase. It is interesting to note that the 5-19 age group (the school age population) has been relatively stable up to 1990, in part due to in-migration, but in steady decline in the last 20 years..
CHART VIII-5: Histogram of Age Distribution
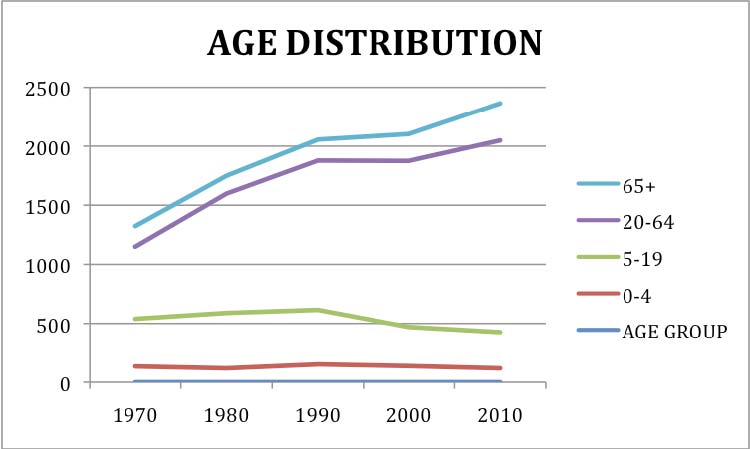
Chart VIII-5 above and Table VIII-6 below also show that the pre-school population has not risen in numbers over the past four decades. The working age population (20-64) continues to increase in numbers and as a percent of the overall population as do the population over 65.
Table VIII-6 below portrays the age and sex distribution for the Town from 1980 until 2010. For both sexes, there has been a large increase in the 35-44 age group. Interestingly, there are more women in the 25-44 age group than men. This gender balance shifts to the men in the 45-64 age group. Perhaps reflecting the slightly longer life expectancies of women, there are more women than men in the over 75 years age group.
TABLE VIII-6: Age and Gender Distribution
| AGE GROUP | MALE | FEMALE | TOTAL | |||||||||||
|---|---|---|---|---|---|---|---|---|---|---|---|---|---|---|
| 1980 | 1990 | 2000 | 2010 | 1980 | 1990 | 2000 | 2010 | 1980 | 1990 | 2000 | 2010 | |||
| 0-4 | 63 | 82 | 69 | 55 | 69 | 49 | 118 | 151 | 137 | 118 | ||||
| 5-9 | 71 | 78 | 60 | 68 | 83 | 75 | 139 | 161 | 173 | 135 | ||||
| 10-14 | 86 | 93 | 95 | 77 | 73 | 78 | 163 | 166 | 160 | 173 | ||||
| 15-19 | 91 | 72 | 77 | 78 | 65 | 72 | 169 | 137 | 138 | 149 | ||||
| 20-24 | 58 | 52 | 38 | 54 | 44 | 30 | 112 | 96 | 72 | 68 | ||||
| 25-34 | 164 | 157 | 97 | 177 | 179 | 94 | 341 | 336 | 237 | 191 | ||||
| 35-44 | 112 | 206 | 162 | 129 | 219 | 177 | 241 | 425 | 446 | 339 | ||||
| 45-54 | 93 | 135 | 230 | 73 | 113 | 252 | 166 | 248 | 424 | 482 | ||||
| 55-64 | 73 | 87 | 200 | 76 | 71 | 194 | 149 | 158 | 226 | 394 | ||||
| 65-74 | 46 | 57 | 95 | 46 | 62 | 94 | 92 | 119 | 138 | 189 | ||||
| 75+ | 21 | 26 | 59 | 38 | 33 | 67 | 59 | 59 | 90 | 126 | ||||
| TOTAL | 878 | 1045 | 1182 | 871 | 1011 | 1105 | 1182 | 1749 | 2056 | 2241 | 2364 | |||
| MEDIAN AGE | 29 | 33.7 | 40 | 44.6 | 45.7 | 30 | 34 | 40 | 45.2 | |||||
PRE-SCHOOL AND STUDENT POPULATION
The pre-school (0-5) population in Plainfield peaked in the 1990's in numbers and has since decreased as a percentage of the total population. In 1990 through 2010 the preschoolers dropped in number as well as a percentage of the overall population. In 1980, there were 118 pre-school children 0-4 (6.8%), compared to 118 pre-school children in 2010 (5.0% of the total population). The student age population (5-19) was relatively stable in actual number (from 471 to 464) over the past two decades. Table VIII-7 below, shows Plainfield School District enrollment trends 1986 - 2000. After a peak in 1989, there has been a gradual decline in enrollment in recent years.
TABLE VIII-7: Plainfield School Population
| Year | K-8 | 9-12* | Total |
|---|---|---|---|
| 1986 | 255 | 116 | 371 |
| 1987 | 282 | 115 | 397 |
| 1988 | 304 | 119 | 423 |
| 1989 | 316 | 117 | 433 |
| 1990 | 309 | 121 | 430 |
| 1991 | 303 | 125 | 428 |
| 1992 | 314 | 113 | 427 |
| 1993 | 300 | 117 | 417 |
| 1994 | 288 | 120 | 408 |
| 1995 | 295 | 111 | 406 |
| 1996 | 285 | 84 | 369 |
| 1997 | 270 | 84 | 354 |
| 1998 | 270 | 90 | 360 |
| 1999 | 284 | 91 | 375 |
| 2000 | 283 | 81 | 364 |
| 2010 | 250 | 83 | 333 |
* Lebanon High School
WORKING-AGE (LABOR FORCE) POPULATION
The working-age group (18-64) is often referred to as the labor force, although not all persons in the group are actually employed or looking for work. This group accounted for the main portion of Plainfield's population increase in the 1980's and 1990's, jumping from 1,063 people in 1980 to 1,312 in 1990(19%) and to 1405 in 2000 (7%). In 2010 this group comprised some 1623 people, an increase of 15.5% over the decade.
ELDERLY POPULATION
The elderly (senior citizen) population is made up of people aged 65 and over. Although most people in this age group are retired, some are employed full or part-time. As is the case nationally, in Plainfield, there are marginally more (6.8% to 6.5%) women than men in this age bracket. The size of this population group in the Town rose from 151 to 315 persons between 1980 and 2010, to 13.3% of the population.. The following table compares Plainfield's elderly population (as a percentage of total population) to those of Sullivan County and the State, showing that the Town actually hosts a much lower percentage of elderly people than do other areas.
TABLE VIII-8: Elderly* Population as a Percentage of Total
| 1970 | 1980 | 1990 | 2000 | 2010 | |
|---|---|---|---|---|---|
| Plainfield | 8.6 | 8.6 | 8.7 | 10.2 | 13.3 |
| Sullivan County | 12.1 | 13.3 | 14.7 | 15.8 | 16.6 |
| New Hampshire | 10.6 | 11.2 | 11.2 | 12 | 13.5 |
*Elderly includes residents 65 years and older
SOURCE: U.S. Census; 1970, 1980, 1990, 2000,2010.
The population of the United States shows a relative increase in the over-65 age group, as the "baby-boom" generation gets older and the effect of lower fertility rates is felt. Plainfield, Sullivan County and New Hampshire also experience this population shift. If the Plainfield in-migration has a notable impact on this trend, The Town will have to consider meeting the special needs of this greater proportion of its population.
POVERTY
Poverty is called a derived measure. The Census and ACS do not measure poverty directly, rather the surveys ask questions about income and family relationships. The answers are used to calculate poverty status. The current official poverty measure has two components: poverty thresholds (income cutoffs) and family income that is compared to these thresholds, as specified by the Office of Management and Budget. More specifically, the thresholds are arranged in a two-dimensional matrix consisting of family size (from one person to nine or more) cross-classified by presence and number of family members under 18 years old (from no children present to eight or more children present). Unrelated individuals and two-person families are differentiated by the age of the reference person (under 65 years old and 65 and older). These thresholds are revised annually to allow for changes in the cost of living as reflected in the Consumer Price Index. The poverty thresholds are not adjusted for regional, state, or local variation in the cost of living.
The original government formula, created in 1955, did not take account of rising costs of medical care and other factors. Ca 2008 the definition of poverty was not changed but the method of its determination was changed resulting in higher reported poverty rates.
TABLE VIII-9: Poverty Level in Select Geographic Areas
| Select Areas | 2000 | 2010 | |||||||
|---|---|---|---|---|---|---|---|---|---|
| Households | Individuals | Households | Individuals | ||||||
| Number | % | Number | % | Number | % | Number | % | ||
| Plainfield | 12 | 1.2 | 63 | 2.8 | 52 | 5.7 | 156 | 6.1 | |
| Sullivan County | 565 | 5.2 | 3367 | 8.5 | 1,899 | 10.4 | 4,330 | 10.0 | |
| Lebanon | 204 | 6.3 | 1089 | 8.8 | 500 | 8.6 | 1,177 | 9.1 | |
| Hanover | 10 | 0.6 | 633 | 9.1 | 323 | 10.9 | 834 | 11.0 | |
| Grafton County | 1033 | 5.1 | 6462 | 8.6 | 3,398 | 9.9 | 8,068 | 9.8 | |
| New Hampshire | 13948 | 4.3 | 78530 | 6.6 | 42,657 | 8.3 | 99,527 | 7.8 | |
| Data from 2000 US Census | Data from ACS 2006-2010 | ||||||||
TABLE VIII-10: Plainfield Poverty Distribution 2010 Census
| Families | Individuals | |||
|---|---|---|---|---|
| Number | % | Number | % | |
| Households below PL | 52 | 5.7 | 156 | 6.1 |
| Married couple households below PL | 1 | |||
| Other family households below PL | 41 | |||
| Male household/no wife present | 24 | |||
| Female householder/no husband present | 17 | |||
| Non family households | 10 | |||
| Children under 18 | 58 | |||
| Children 5 or under | 22 | |||
TABLE VIII-11: Plainfield Poverty Distribution ACS_SF 2006-2010 Estimates
| Plainfield Population Estimate | 2540 | |||
|---|---|---|---|---|
| # | Male | Female | TOTAL | |
| Under age 6 under PL | 185 | 22 | 0 | 22 |
| Age 6-11 | 255 | 2 | 24 | 26 |
| Age 12-17 | 168 | 6 | 0 | 6 |
| Age 18-24 | 81 | 0 | 0 | 0 |
| Age 25-34 | 213 | 24 | 32 | 56 |
| Age 35-44 | 453 | 0 | 10 | 10 |
| Age 45-54 | 406 | 11 | 8 | 19 |
| Age 55-64 | 526 | 0 | 8 | 8 |
| Age 65-74 | 138 | 0 | 0 | 0 |
| Age 75 and over | 115 | 9 | 0 | 9 |
| Total | 2540 | 74 | 82 | 156 |
| NH Poverty and NH Poverty 1 | ||||
*See Economic Chapter for definition of families below poverty line and poverty line distribution by household size.
| Earned Income :: Social Security Income :: Public Assistance Income | ||
|---|---|---|
| Number | % Households | |
| Total Households | 915 | 100 |
| Households with earned income | 835 | 91 |
| Median Household Income | 85966 | |
| Mean Household Income | 102222 | |
| Median Family Income | 87216 | |
| Mean Family Income | 106686 | |
| 63583 | ||
| Households with SSI | 245 | 26.8 |
| Median SSI | 12817 | |
| Households with Supplementary SSI | 7 | 0.8 |
| Median Supplementary SSI | 1386 | |
| Households with Public Assistance Income | 0 | 0 |
| Median Public Assistance Income | 0 | |
Source: ACS 2010-DPO3 PLH
Population projections are the basis for much of our future planning for the community.
In the, 1980-1990 decade Plainfield experienced a relatively large, (17.6%), increase in population, compared to Sullivan County (7.0%), and New Hampshire (20.5%) as a whole. In the 1990-2000 decade the growth in Plainfield was a more modest 9.2% compared to 9.7% in the Lebanon/Hanover/Hartford area. Sullivan County grew at only 4.8% in the the 1990-2000 decade while New Hampshire grew at 11.4%.
In the 2000-2010 decennial Plainfield's growth has dropped to 5.5%
Compared to its neighbors, Plainfield is sparsely settled, with 44.6 people per square mile. Plainfield owes much of its population gains to in-migration. The 20-64 age group is now 62.3% of the 2000 population and the over 65 population is now 13.3% of the population. The size of the 0-5 age group is currently 4.99% of the population. The 5-17 age group is 19.3% of the population, which is a decrease over previous years. Plainfield has experienced real gains in its potential labor force. The decease in the pre-school population is worrisome.
Population projections for small communities are at best challenging. Any unexpected change in the economy, such as the addition of a large industry or the closing of a major employer, may drastically alter the reliability of a projection. Therefore, one should view population estimates as a general guide that must be updated continuously as new information becomes available, and as economic conditions change.
| Year | 1997 PROJECTIONS | Actual per CENSUS |
|---|---|---|
| 1990 | 2056 | 2056 |
| 2000 | 2216 | 2241 |
| 2010 | 2364 | 2363 |
| 2015 | 2454 | |
| 2020 | 2526 | |
Chart VIII-12 above shows. New Hampshire Office of Energy and Planning projections from 1997 based on a least squares fit of the past data. This model will generally reflect the more recent growth trends and this generally results in somewhat higher projections. The OEP model is based on a computer forecasting system (DEMOS) that also models the growth patterns of many distinct sectors of New Hampshire's population and economy, taking into account the important interrelationships that exist among them. With the advent of the American Community Survey and its projections OEP has discontinued projecting community growth. ACS projections as of 2010 have too great a probability of error associated with forecast to be used at this time. The 1997 OEP projections have been reasonably accurate and are retained for the 2010 Master Plan.
The 2010 census data tells us that our community is aging, and becoming more affluent. In 1980 there were 59 individuals in town over age 75, and in 2010 there were 126.
42% of all Plainfield households have incomes over $100,000 and 10% have incomes over $200,000. Yet 51 households (5.5%) have incomes under $20,000, and these are primarily families with children. There are 48 children in town under age 18 who live below the poverty level.
We are experiencing a drop in school age children, which has significant impacts for out schools. Thirty children at PES (12% of the total PES population) are living below the poverty line.
Great income disparities among Plainfield residents can create tension between those who may want, and can afford, increased town and school services, and those who are struggling financially and fear any increased town tax burden. While there are some remedies for low income seniors in the "elderly exemption" the recent census data tells us there are actually relatively few seniors living below the poverty level.
1) The Selectboard should appoint a committee to examine and discuss how the community can best provide services and support to the growing number of seniors, and also to children and families who are living below the poverty level. The committe would include representatives from the select and school boards, the town welfare director, town recreation director, and other interested parties.