|
-- What is a co-occurence map?
-- What does the Plainfield co-occurence map show?
-- How can a co-occurence map be used?
-- Setting Priorities: What's next?
What is a co-occurrence map?
Any map which shows the impact of having a number of resources in the same geographic area is a co-occurrence map. Conceptually, each of the features is located on a separate, transparent map; and then these maps are overlaid so that the locations with more co-located occurrences of the separate factors appear darker than those locations with fewer occurrences. This was once accomplished with actual transparent overlays, but with the development of computer mapping, a summary map can be generated showing the locations where different numbers of factors are co-located. The co-occurrence map shows these locations by color where the darker the color, the greater the number of factors in that specific area. To see how a co-occurrence map works, look at our sample map (357kb).
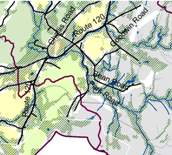
What does the Plainfield Co-occurrence map show?
The Plainfield co-occurrence map (1.45 mg) combines natural features including wetlands, aquifers, prime agricultural soils, unique habitats, with other features to show which areas have the greatest conservation value for the Town.
How can a co-occurrence map be used?
Co-occurrence maps can illustrate combined natural resources or political resources. In either case the value of the map increases with the accuracy of the data used to create it. Our natural resource maps use data which is approximate so any conclusions suggested by the maps must be verified by site specific analysis on the ground. Even so, co-occurrence maps are a very powerful planning tool.
Setting priorities: What’s next?
Co-occurrence maps can assist Town planning by identifying areas of special significance or by predicting the impact of our current regulations:
- Sensitive or prime habitat: Using features such as south-facing slopes, riparian buffers along surface waters, unfragmented land, specific ground cover types, wetlands, known colonies of rare species, and other factors, a map can be created showing those areas most likely to be beneficial to wildlife or plants.
- Groundwater protection: A map showing aquifers, surface waters, wetlands, wells, known point and non-point pollution sources, and population density can help identify areas which may need special regulation in order to protect our groundwater.
- Conservation priorities: Combining natural features, habitat and water resources can identify areas or parcels which have the greatest conservation value and help set priorities for the Town’s conservation plan.
- Build-out analysis: By subtracting the acreage of protected or restricted land from a particular Zone, the theoretical maximum number of building lots can be calculated for the remaining land in that Zone. This data can be used to estimate the population potential allowed by current zoning regulations and can be a very powerful planning tool.
|